Climate Water Deficit
RCP 8.5 Business as Usual

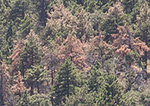 Hot Drought
Is a term used by climate scientists to describe the recent drought, which was caused by higher temperatures as well as lower than normal precipitation. Due to rising temperatures, by the end of the current century what was considered a drought in the last century will become an average year. MORE
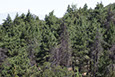 Migrating Plants
In the nearby Santa Rosa Mountains the dominant plant species have moved upslope an average of 65 meters in the last 30 years. Similar results are reported around the world. What happens to those that have no where to go, already at the top of the mountain? MORE
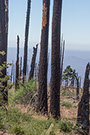 Frequent Fires
Wildfire risk increases by 55%, or twice the projected increase under the enlightened government scenario.
Average rings represent average climate water deficit, plant's evaporative demand that exceeds soil moisture during 1950-2000. For every 4% decrease in annual climate water deficit the rings are darker and further apart, for every 4% increase in climate water deficit, the rings are lighter and closer together. In the 2090s climate water deficit will average 16% more than last century. For more info see technical notes.