Climate Water Deficit
Historical Data

Average
Ring:
2009 Laguna Mountains Skipper
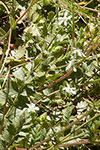 a butterfly declared endangered in 1997, continues to decline, and is now only present on Palomar Mountain. Although in 1997 the Laguna Mountains accounted for over half its range, populations there have disappeared. The butterfly is dependent on a plant, Cleveland's horkelia, which has been decimated by development and overgrazing.
1997 Multiple Species Conservation Program
 Science magazine listed San Diego County as one of two "hot spots" in the US, containing unique and unusual species. The MSCP provides for large connected preserve areas that address the needs of a number of species at the habitat level, rather than trying to address each species and area separately. As the climate warms how will the program be adjusted to account for changing habitat needs?
1908 Cleveland National Forest
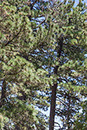 was created to protect the watershed from erosion due to excessive grazing and cutting of timber. At the turn of the century the population of the entire county was only about 35,000 people compared to over 3 million today, but even such a small population put a heavy demand on resources.
1950 Quino Checkerspot
 was found on every coastal bluff, mesa top and lower mountain slope in San Diego. By 1997 the butterfly was listed as endangered, its habitat fragmented, lost to urban development, agriculture, and invasive non-native plants. Since then populations have declined by 95%. The San Diego zoo is currently breeding the butterfly in an effort to forestall extinction.
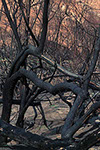
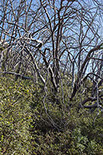 2003 Cedar Fire
burned 280,000 acres in San Diego County, the largest fire in California history. Fifteen people died, 2820 buildings were destroyed, and most of Cuyamaca State Park burned. Currently, grayed trunks of the former forest poke through dense shrubbery. Will the conifers return? MORE
 2007 Wildfires
burned even a larger area in southern California, from Santa Barbara to San Diego, than the 2003 fires. In San Diego County, 500,000 people were under orders to evacuate. In the subsequent decade fires have continued to ravage the western US. Scientists estimate that human induced climate change has doubled the area burned in last thirty years.
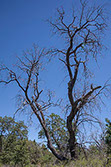 2008 Goldspotted Oak Borer
introduced from Arizona, is linked to extensive mortality of mature coastal live oak, canyon live oak, and black oak in San Diego County. Since 2008, this beetle has continued to spread and is now found throughout southern California. Can you imagine California without these common oak species?